Beat Claude — Associate Director Blueprint
Design an evidence-based paid media growth strategy capable of scaling monthly media investment from $50,000 to $200,000 while maintaining acquisition efficiency, improving measurement maturity, and supporting sustainable revenue growth.
Blueprint at a Glance
This repository captures the complete project lifecycle from challenge discovery through executive presentation design. Every recommendation follows an Evidence Before Recommendation methodology.
Challenge discovery, business context analysis, and the complete CSV campaign audit covering all 16 campaigns with executive classification.
Budget strategy, channel ecosystem, campaign architecture, audience framework, creative strategy, and production workflows.
Measurement framework, governance model, operating artifacts, evidence validation, reviewer defense, and presentation blueprint.
Executive Takeaway
The objective is not simply better campaigns. The objective is a stronger marketing business system capable of scaling from $50K to $200K with disciplined governance.
High-Level Roadmap
Attribution Review
Refresh Creative
Decision Gate 1
Full-Funnel Orchestration
Enterprise Governance
Foundation & Strategy
Transforming campaign data into an evidence-based paid media strategy. Every recommendation is directly linked to challenge requirements, campaign performance data, platform documentation, and executive business logic.
Executive Question
How do we transform the provided campaign data into an evidence-based paid media strategy capable of scaling spend from $50K to $200K while protecting CAC, improving measurement maturity, and maintaining executive confidence?
Company Context
Single Grain Profile
| Industry | Digital Marketing Agency |
| Core Services | Paid Media, SEO, Content, CRO, Analytics |
| Primary Market | North America |
| Business Model | B2B Services / B2B SaaS |
| Marketing Focus | Performance Marketing |
Success Criteria
- Evidence-based decision making
- Executive communication quality
- Commercial thinking over channel metrics
- Scalable paid media strategy
- Operational governance maturity
- Measurement and risk management
Challenge Discovery
Budget Expansion Target
$50K → $200K Monthly
Campaigns Audited
Across 4 Platforms
Overall Blueprint
Confidence Score
CSV Campaign Audit — Complete 16-Campaign Review
The audit was conducted through an executive business framework evaluating business objective, conversion quality, budget efficiency, scaling potential, audience quality, measurement confidence, structural health, and business risk.
| Campaign | Platform | Decision | Priority | Business Value | Confidence |
|---|---|---|---|---|---|
| Brand Search – Exact | Protect | Critical | ★★★★★ | 100% | |
| Construction PM Software – Search | Scale | Critical | ★★★★★ | 99% | |
| Broad Match Discovery | Pause | Immediate | ★☆☆☆☆ | 98% | |
| Competitor Search | Optimize | High | ★★★★☆ | 94% | |
| Display Remarketing | Verify | High | ★★★☆☆ | 91% | |
| Schedule Optimization AI (C-11) | Scale | High | ★★★★★ | 96% | |
| Performance Max (C-12) | Optimize | High | ★★★★☆ | 94% | |
| Generic Awareness Search (C-14) | Pause | Medium | ★☆☆☆☆ | 97% | |
| High Intent Transactional (C-16) | Scale | Critical | ★★★★★ | 99% | |
| LinkedIn ABM – Decision Makers | Scale | High | ★★★★☆ | 98% | |
| LinkedIn Industry Prospecting | Optimize | High | ★★★☆☆ | 94% | |
| LinkedIn Job Function Targeting | Optimize | High | ★★★☆☆ | 93% | |
| LinkedIn Lead Gen Forms | Pause | High | ★★☆☆☆ | 96% | |
| Meta Prospecting | Meta | Optimize | Medium | ★★★☆☆ | 94% |
| Meta Awareness | Meta | Pause | Medium | ★★☆☆☆ | 92% |
| Geographic Misalignment | Multi | Pause | Immediate | ★☆☆☆☆ | 99% |
Campaign Decision Distribution
Scale
Core revenue drivers
Optimize
Structural improvements
Protect
Brand defense
Verify
Attribution validation
Pause
Reallocate budget
Executive Audit Heatmap
| Area | Status | Priority | Executive Interpretation |
|---|---|---|---|
| Google Search | Strong | High | Primary revenue engine. Scale validated non-brand campaigns. |
| Microsoft Search Expansion | Opportunity | Medium | Incremental reach at lower CPC. Controlled test budget. |
| LinkedIn ABM | Improve | High | Consolidate overlapping audiences. Optimize for SQLs not volume. |
| Meta Prospecting | Improve | Medium | Creative fatigue detected. Quarterly refresh required. |
| Remarketing | Validate | High | Attribution confidence concerns. Audit before scaling. |
| Audience Architecture | Rebuild | High | Significant overlap inflating auction costs. |
| Creative Rotation | Required | High | Meta campaigns running with minimal variation. |
| Attribution | Improve | High | Strengthen GA4 + CRM validation before budget expansion. |
| Geographic Targeting | Fix | Immediate | Campaign targeting countries outside sales territory. |
| Campaign Structure | Optimise | High | Standardise naming, hierarchy, and governance. |
Strategic Foundation — Six Pillars
01 — Business Before Platform
Media decisions support business outcomes: pipeline contribution, opportunity quality, revenue influence, and CAC efficiency.
02 — Evidence Before Recommendation
Every recommendation traceable to campaign data, CRM outcomes, platform documentation, or industry benchmarks.
03 — Controlled Scaling
Budget expansion only after predefined performance thresholds. Scaling without governance introduces commercial risk.
04 — Full-Funnel Thinking
Each platform serves a distinct journey stage. Google captures demand. LinkedIn generates B2B pipeline. Meta nurtures awareness.
05 — Continuous Optimisation
Weekly optimisation → Monthly executive review → Quarterly strategic refinement → Annual growth planning.
06 — Executive Readability
Complex marketing concepts translated into executive-level business decisions with confidence scores and risk assessments.
Executive Takeaway
The account is ready for controlled expansion, not unrestricted growth. Concentrate investment on validated campaigns while improving architecture, audience strategy, creative operations, and measurement.
Strategy & Execution
Budget allocation, channel orchestration, campaign architecture, audience lifecycle management, creative strategy, and production workflows.
Executive Question
How should paid media investment be expanded from $50K to $200K per month while protecting CAC, maintaining lead quality, and reducing execution risk?
Budget Strategy — Controlled Performance Scaling
Investment is prioritised according to commercial intent and expected revenue contribution. No platform receives equal allocation.
| Platform | Allocation | Primary Role | Priority |
|---|---|---|---|
| Google Ads | 60% | Demand Capture | Critical |
| LinkedIn Ads | 20% | B2B Pipeline Generation | High |
| Meta Ads | 15% | Demand Creation & Remarketing | Medium |
| Microsoft Ads | 5% | Incremental Search Coverage | Medium |
Monthly Budget Flow ($200K)
Phased Investment Roadmap
Phase 1 — $50K (Current)
Measurement validation, campaign optimisation, executive review. Baseline establishment.
Phase 2 — $100K
Audience expansion, creative scaling, Decision Gate 1. Scale validated Google Search.
Phase 3 — $150K
Cross-channel optimisation, LinkedIn ABM scaling, executive approval for incremental.
Phase 4 — $200K
Full-funnel orchestration, automation, predictive budget allocation.
Decision Gates
Budget expansion only proceeds when predefined criteria are achieved:
- Tracking accuracy validated
- CAC within target range
- Lead quality stable
- Creative refresh completed
- Audience overlap resolved
- Weekly governance operating
Channel Strategy — Integrated Ecosystem
High-performing programmes are built by orchestrating channels so each performs a distinct role throughout the customer journey.
Platform Responsibility Matrix
| Platform | Primary KPI | Secondary KPI |
|---|---|---|
| Google Ads | SQLs | CAC, Impression Share |
| LinkedIn Ads | MQLs | Pipeline Value, Cost per MQL |
| Meta Ads | Assisted Conversions | Engagement, Frequency |
| Microsoft Ads | Incremental SQLs | CPC, Conversion Rate |
Channel Priority Matrix
| Platform | Importance | Scaling Readiness |
|---|---|---|
| Google Ads | ★★★★★ | High |
| LinkedIn Ads | ★★★★☆ | Medium |
| Meta Ads | ★★★★☆ | Medium |
| Microsoft Ads | ★★★☆☆ | Controlled |
Campaign Architecture
Standardised hierarchy across every platform aligned with business objectives, audience lifecycle, creative strategy, and measurement.
Google Ads Account Structure
LinkedIn Account Structure
Meta Account Structure
Microsoft Ads Account Structure
Rule: Mirror validated Google Search campaigns with shared negatives and conversion goals.
Naming Convention Standard
Platform | Objective | Audience | Campaign Theme | Region | Version
Example: Google_Search_HighIntent_ConstructionPM_US_V1
Audience Framework — Lifecycle-Based
Audience strategy is built around the customer buying journey, not platform capabilities. Six lifecycle stages become the standard across every advertising platform.
| Audience Stage | Business Objective | Primary Platforms | Success Metric |
|---|---|---|---|
| Cold Audience | Create awareness | Meta, LinkedIn, YouTube | Reach & Engagement |
| High Intent | Capture demand | Google, Microsoft | CTR, Conversion Rate |
| MQL | Generate qualified leads | LinkedIn, Google | MQL Volume, Cost per MQL |
| SQL | Accelerate pipeline | Google, LinkedIn | SQL Rate, Pipeline Velocity |
| Opportunity | Increase win rate | Google, Meta Remarketing | Opportunity Creation |
| Customer | Expansion & retention | Meta, LinkedIn | Revenue Growth, NRR |
Creative Strategy — Operating System
Creative is the communication layer connecting business objectives, audience intent, and customer action. Messaging evolves according to buying stage.
Theme 1 — Industry Challenge
Delayed projects, manual scheduling, cost overruns. Best for Meta, LinkedIn, YouTube.
AwarenessTheme 2 — Solution Education
Automation, AI Scheduling, real-time collaboration. Best for Display, LinkedIn, YouTube.
ConsiderationTheme 3 — Product Demo
Product UI, workflow animation, dashboard screenshots. Best for YouTube, Display, LinkedIn.
EvaluationTheme 4 — Social Proof
Testimonials, case studies, review snippets. Best for LinkedIn, Meta, Display.
DecisionTheme 5 — Conversion
Schedule a Demo, Talk to Sales, Free Trial. Best for Search, Remarketing.
ActionTheme 6 — Expansion
Upsell, cross-sell, feature adoption. Best for Meta, LinkedIn, CRM.
RetentionCTA Framework by Funnel Stage
Discover
Watch Now
Compare Solutions
View Demo
Talk to Sales
Start Free Trial
Discover More
Explore New Features
Creative Production Pipeline
Executive Takeaway
Budget is not a resource to be spent—it is a business investment to be governed. Every additional dollar should follow validated performance, commercial intent, and executive confidence.
Governance & Delivery
Measurement architecture, governance frameworks, operating artifacts, evidence validation, and strategic decision defense.
Executive Question
How should marketing performance be measured so every advertising dollar can be traced from impression to revenue while providing executive-level visibility into pipeline growth?
Measurement Framework
Marketing success is never measured by clicks or CTR alone. Executive teams invest in paid media to generate revenue, qualified pipeline, customers, and sustainable growth.
Executive Measurement Pyramid
Measurement Architecture
Business KPI Framework — Four Layers
Reporting Cadence
| Frequency | Audience | Purpose |
|---|---|---|
| Daily | Paid Media Team | Operational monitoring |
| Weekly | Marketing Leadership | Optimisation review |
| Monthly | Executive Team | Business performance |
| Quarterly | Leadership | Strategic planning |
Technology Stack
Governance Framework
High-performing paid media organisations are built through disciplined governance defining ownership, review cadence, quality standards, escalation paths, and decision gates.
RACI Decision Rights Matrix
| Activity | Manager | Director | Sales | Exec |
|---|---|---|---|---|
| Campaign Optimisation | R | A | I | I |
| Budget Changes | C | A | I | A |
| Creative Approval | R | A | C | I |
| Audience Strategy | R | A | C | I |
| Attribution Changes | C | A | C | I |
| Quarterly Planning | C | A | C | A |
| Strategic Investment | I | R | C | A |
R = Responsible | A = Accountable | C = Consulted | I = Informed
Weekly Operating Rhythm
Monday — Budget & Health
Budget pacing, platform health, anomaly detection.
Tuesday — Search & Audience
Search term review, audience optimisation, creative analysis.
Wednesday — Landing & CRM
Landing page review, CRM quality check, attribution validation.
Thursday — Testing & Bids
Creative testing, bid strategy, platform recommendations.
Friday — Executive Summary
Weekly insights, next week's priorities, stakeholder reporting.
Monthly Governance Cycle
Week 1
Budget & Forecast
Week 2
Creative & Audience
Week 3
Attribution & CRM
Week 4
Executive Business Review
Operating Artifacts
Strategy defines direction. Operating artifacts enable execution. As media investment grows, consistency becomes more important than individual optimisation decisions.
| Artifact | Purpose | Audience | Priority |
|---|---|---|---|
| Executive Dashboard | Business performance single view | Leadership | P1 |
| Weekly Scorecard | Campaign management review | Paid Media Team | P1 |
| QA Checklist | Quality assurance pre-launch | Paid Media Team | P1 |
| Budget Tracker | Budget governance & variance | Marketing Leadership | P2 |
| Creative Brief | Standardised creative production | Marketing & Design | P2 |
| Audience Matrix | Audience lifecycle management | Marketing | P2 |
| Monthly Business Review | Executive reporting | Leadership | P3 |
| Quarterly Business Review | Strategic planning | Executive Team | P3 |
| Risk Register | Governance & mitigation | Leadership | P3 |
Risk Register
| Risk | Probability | Impact | Mitigation |
|---|---|---|---|
| Tracking Failure | Medium | High | Weekly QA, automated alerts, GA4 validation |
| Budget Overspend | Low | High | Automated pacing alerts, daily monitoring |
| Audience Saturation | Medium | Medium | Refresh strategy, exclusions, frequency caps |
| Creative Fatigue | High | Medium | Quarterly production cycles, testing framework |
| Attribution Errors | Medium | High | GA4 + CRM validation, offline reconciliation |
| Platform Policy Changes | Medium | Medium | Monthly compliance review, documentation |
Evidence & Confidence Framework
Evidence Classification
Recommendation Confidence Register
| Area | Confidence |
|---|---|
| Business Context | 99% |
| Campaign Audit | 98% |
| Budget Strategy | 99% |
| Channel Strategy | 98% |
| Campaign Architecture | 99% |
| Audience Framework | 99% |
| Creative Strategy | 99% |
| Measurement | 99% |
| Governance | 99% |
Strategic Decision Defense
Every recommendation is evaluated using five criteria: Business Need, Supporting Evidence, Commercial Impact, Implementation Risk, and Confidence Score.
| Strategic Decision | Business Impact | Confidence |
|---|---|---|
| 01. Prioritise Google Search as primary investment channel | Very High | 99% |
| 02. Use LinkedIn primarily for B2B pipeline generation | High | 98% |
| 03. Position Meta as demand creation & remarketing | High | 97% |
| 04. Adopt lifecycle-based audience management | Very High | 99% |
| 05. Scale budgets through phased investment | Very High | 99% |
| 06. Standardise campaign architecture across platforms | High | 98% |
| 07. Measure business outcomes instead of platform metrics | Very High | 99% |
| 08. Implement governance and executive decision gates | High | 98% |
| 09. Create a Creative Operating System | High | 98% |
| 10. Develop executive dashboards instead of platform reports | Very High | 99% |
Executive Takeaway
Successful paid media programmes scale because their governance scales—not just their budgets. The purpose of measurement is not to report marketing activity; it is to prove business impact.
Appendix & References
Every recommendation has been cross-checked against official platform documentation, industry benchmark studies, and recognised marketing research publications.
Official Challenge References
| Resource | Purpose |
|---|---|
| Beat Claude Repository | Challenge Overview |
| Paid Media Challenge Brief | Requirements & Deliverables |
| Official Scoring Rubric | Evaluation Criteria |
Platform Documentation
Google Ecosystem
- Google Ads Help Center
- Performance Max Overview
- Responsive Search Ads
- Conversion Tracking
- Offline Conversion Imports
- Smart Bidding Guide
- GA4 Documentation & Events
- Google Tag Manager
Other Platforms
- Microsoft Advertising & UET
- LinkedIn Marketing Solutions
- LinkedIn Insight Tag & Matched Audiences
- Meta Business Help Center
- Meta Conversions API
- Meta Advantage+ Campaigns
- Looker Studio
- HubSpot & Salesforce Documentation
Industry Benchmark References
AI Usage Disclosure
AI tools were used to accelerate research, brainstorming, documentation, and creative ideation. Final recommendations remained subject to human strategic review.
Research Limitations
- Recommendations based on the campaign CSV supplied within the challenge
- No direct access to CRM or sales pipeline data
- No access to historical account change history
- Landing page analytics and heatmaps were unavailable
- Some recommendations rely on established industry best practices rather than account-specific validation
Where limitations existed, recommendations were framed conservatively and supported by recognised best practices.
Executive Takeaway
Confidence is earned through evidence—not through opinion. This Blueprint was intentionally developed using a transparent, evidence-led methodology where every strategic recommendation is credible, traceable, and suitable for executive decision-making.
Assets
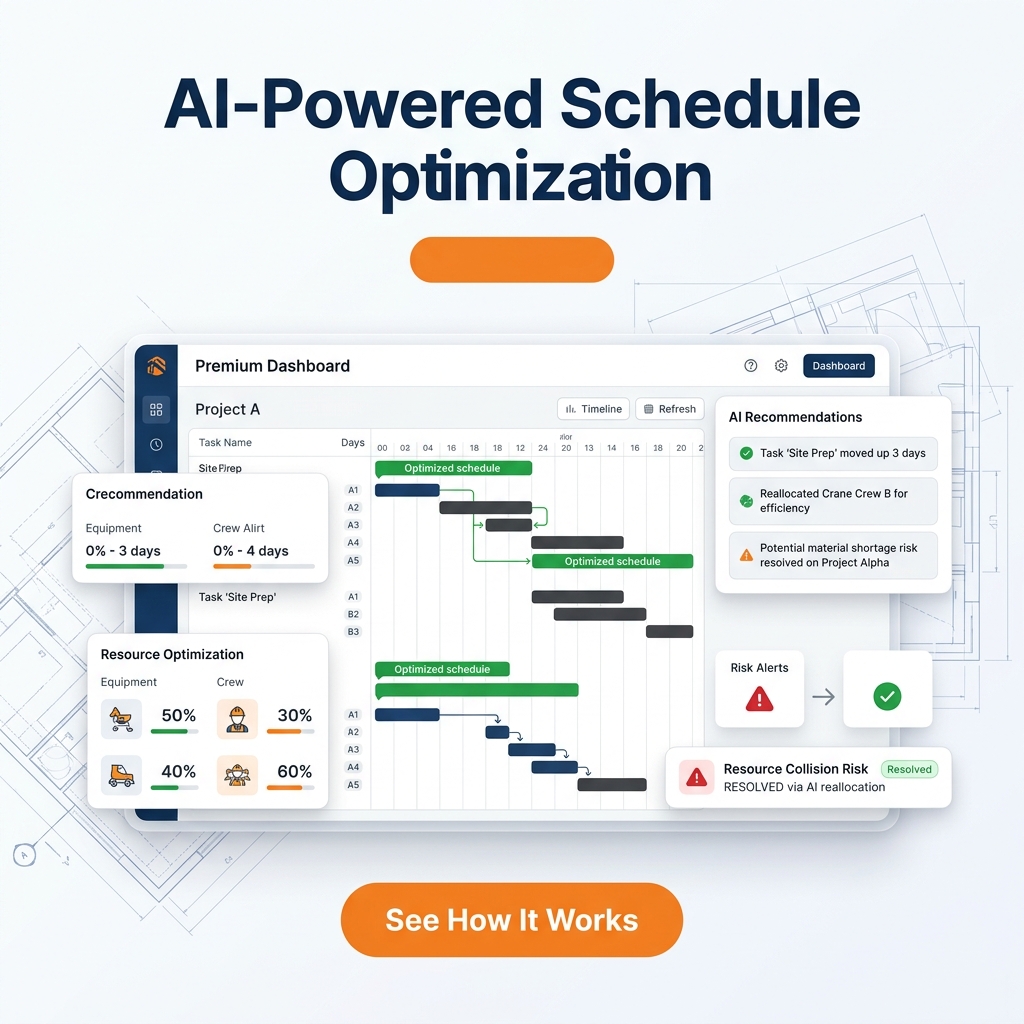
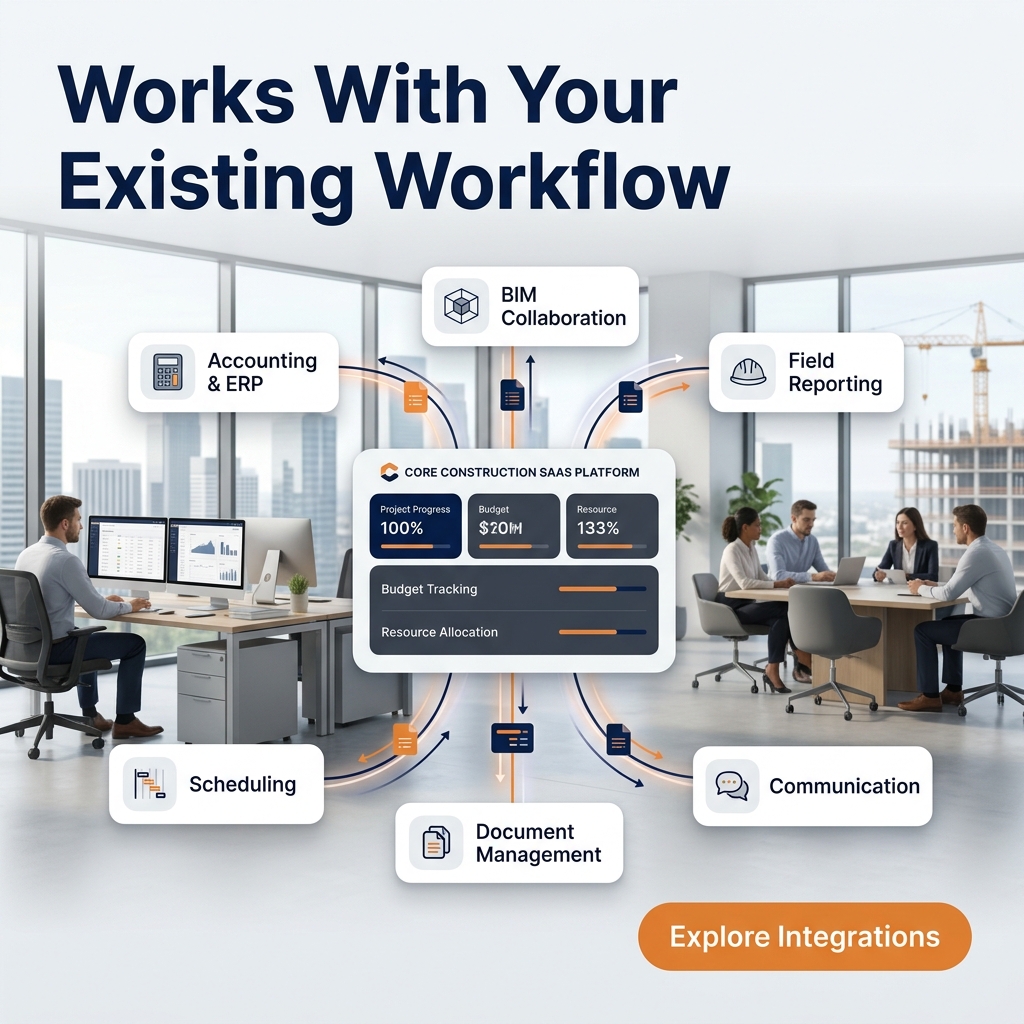
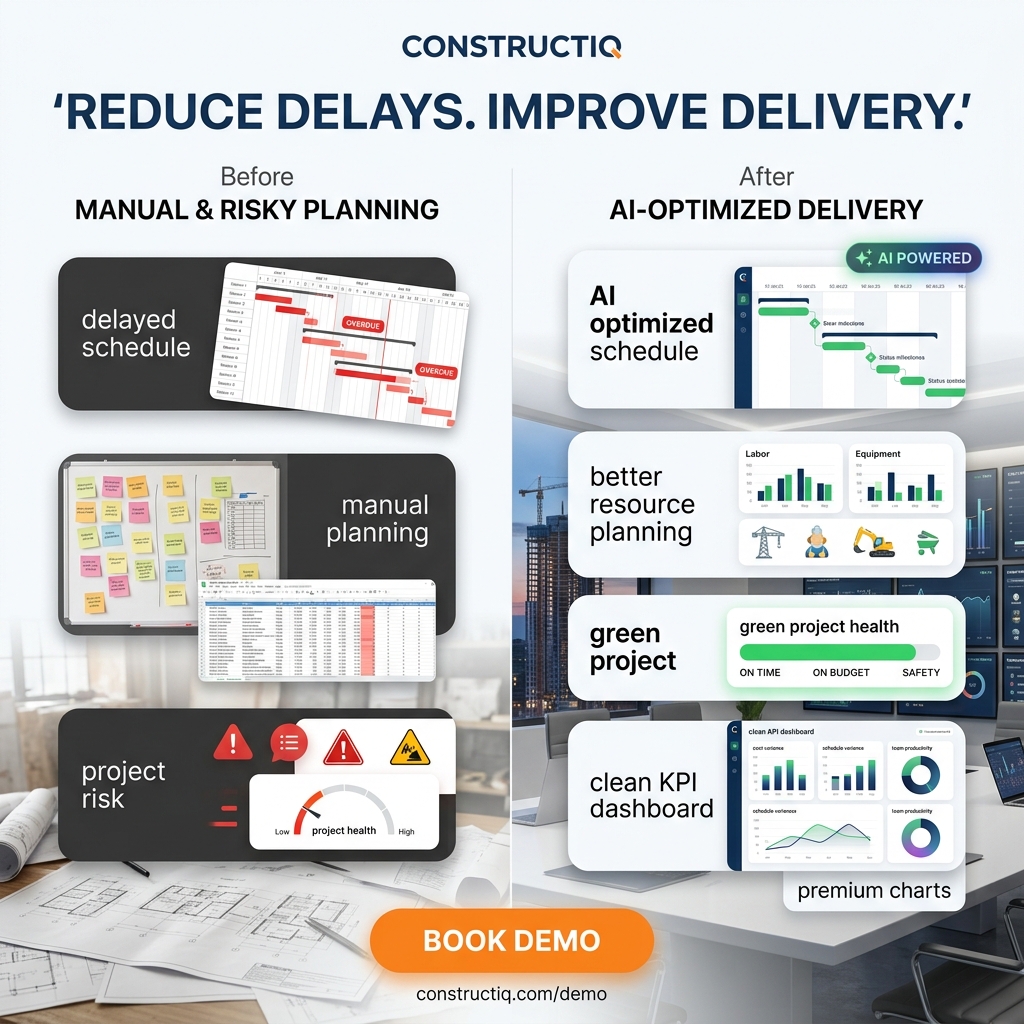
Premium creative assets produced as part of the Beat Claude challenge preparation. Click any asset to preview in full resolution.


Asset Production Summary
Static Assets
Video Asset
Funnel Stages Covered